If you could get horse farm and stable owners/managers and riding instructors in one room, what would you ask them? Over the years, we at Stable Management have tweaked and refined our Business Survey to try and provide the responses to the questions you want answered. We also created the spring Fees Survey to delve deeper into the specifics of running a boarding and lesson business. You can find the article about that Spring 2016 Fees Survey on StableManagement.com.
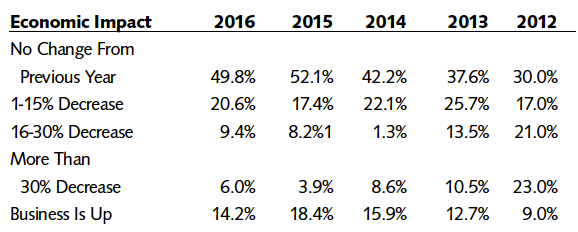
This year’s survey is a mix of good and not-so-good news. For the first time since 2012, when we started this survey, the results did not show a positive overall economic uptick on the respondents’ equine businesses compared to the previous year. More declines and fewer increases in business showed that the equine industry is still in recovery.
Who Answered the Surveys?
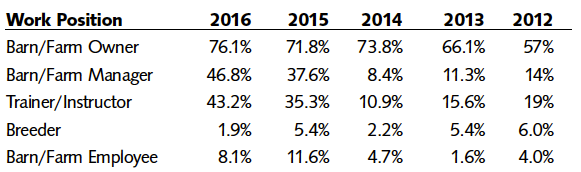
The vast majority of people who answered this year’s salary sur- vey said that their primary jobs in their equine businesses were as barn/farm owners (76.1%). We allowed respondents in 2015 and 2016 to select the top three positions they held at the facility. That might account for the rise in “Barn/Farm Manager” and “Train- er/Instructor” responses, as the farm owner might have selected “Owner” in past years, rather than the other categories.
Also, because of our association with the Certified Horsemanship Association and the certified stables and instructors of PATH Intl., which started in 2015, it’s not surprising to see that the percentage of instructors and trainers rose dramatically in 2015 among those answering the survey, and continued to climb in 2016. Breeders rose significantly in the results from past years.
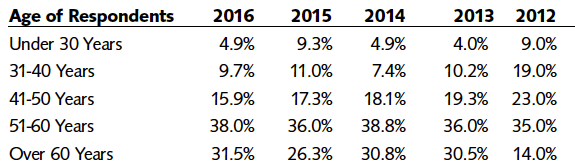
The age of the respondents continues to be of some concern, with 69.5% of respondents indicating that they are 51 years old or older. While we know that older women are the backbone of the general horse-owning population based on many other surveys, this still raises concerns about who will own or manage these equine facilities and farms when these women
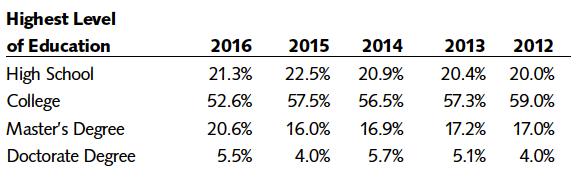
These farm and stable owners are highly educated, with nearly 79% having an undergraduate or advanced college degree.
These farm and stable owners are highly educated, with nearly 79% having an undergraduate or advanced college degree.
The areas of the country (and world) where the respondents reside were fairly evenly distributed and seemed to match the demographics of horse numbers seen in other surveys. There was a higher number of people from the Midwest who answered the survey this year.
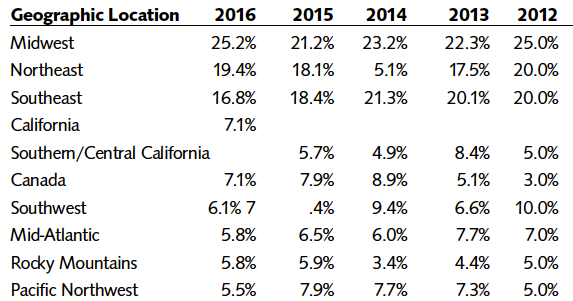
(Editor’s note: We had a glitch in the survey and didn’t include a region for Northern California in 2015, and in 2016 we tallied all of California together.)
About Their Businesses
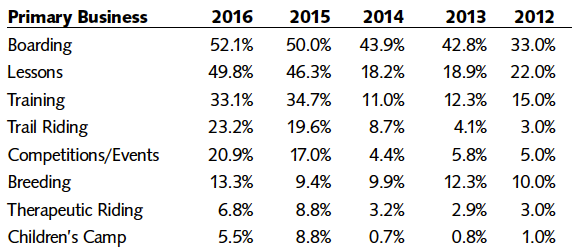
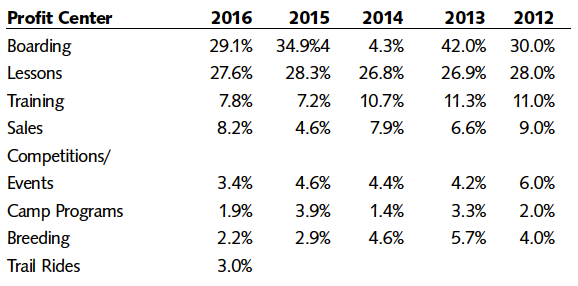
Boarding continued to be the primary business of respondents, who were allowed to select their top three areas of focus.
Of the 17.4% who answered “Other” to the question of their businesses’ main focus, there were various responses and multiple facility uses, including rehabilitation, retired or rescue horses, natural horsemanship and university or Pony Club programs.
The survey also broke down income into profit centers. We included “Trail Rides” for the first time this year, as this activity had become a significant portion of the write-ins for “Other” profit centers. Sales showed an increase this year as a profit center.
The 16.8% who answered “Other” included a wide variety of answers, from harness racing and sleigh rides to consulting and “no profit.”
We asked what types of horses were on the respondents’ properties, prompting them to include all categories that applied. The top answers are as follows:
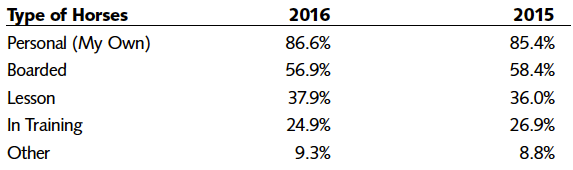
The “Other” responses included trail horses, retired or rescued equines, and breeding stock.
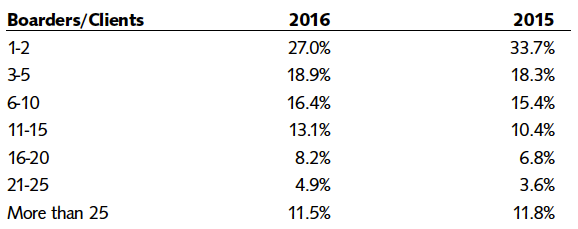
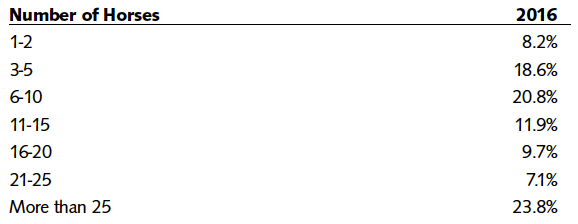
Respondents to the 2014 survey also wanted to know if the number of boarders/clients was increasing or decreasing, so we began asking that question in our survey last year. It is encouraging that there was an increase in each level of six or more boarders/clients, except at the very top level (more than 25), which was very close to last year’s number.
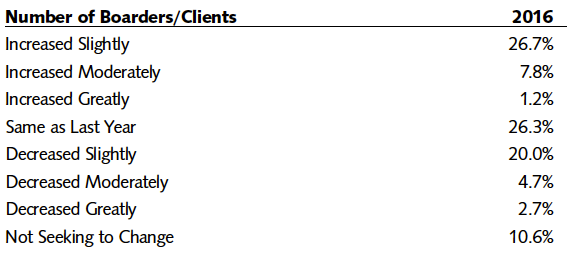
Respondents wanted to know whether that number of boarders/clients was increasing or decreasing in the industry. This year’s survey showed that 26.3% were unchanged from 2015, while 35.7% showed increases and 27.4% showed decreases. It is interesting that nearly 11% were not seeking to change their number of boarders/clients.
Another new question added in 2016 concerned how many horses the respondents owned, managed and/or boarded at their facilities.
Discipline
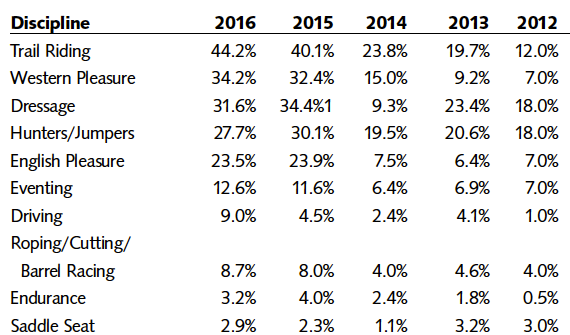
Trail riding continued to dominate when our respondents were asked about the primary disciplines of their businesses. We allowed respondents to select the top three disciplines at their facilities, and those responses are reflected below. In this year’s survey, Western Pleasure overtook dressage to move up to second, and driving’s number doubled from last year.
Making Money
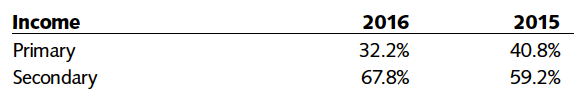
In the 2016 survey, 67.8% of respondents said that their equine businesses were their secondary means of income, which was an increase from last year’s results.
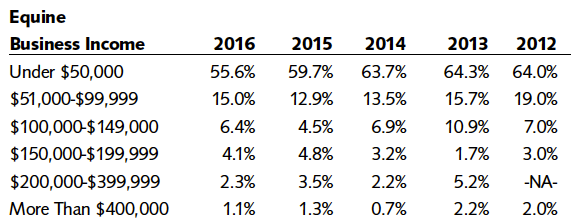
As you can see in the next chart, nearly 56% of equine businesses are making less than $50,000 per year. There were increases in the segments with incomes from $51,000 to $149,000. Each segment above that showed decreases from last year. The average yearly income breaks down as follows:
In the 2016 survey, 67.8% of respondents said that their equine businesses were their secondary means of income, which was an increase from last year’s results.
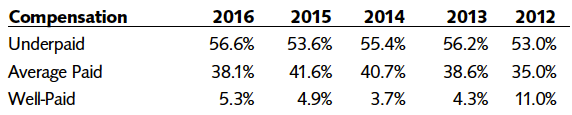
When respondents were asked whether they considered themselves well compensated, the majority felt they were underpaid.
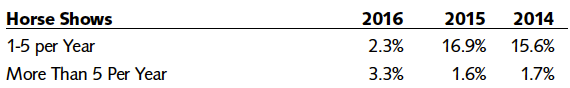
A new question we asked last year was whether the facilities hosted or ran horse shows and how many shows they held; 84.4% did not host a show in 2016 and 3.3% had more than five shows per year.
Farm/Facility Staffing
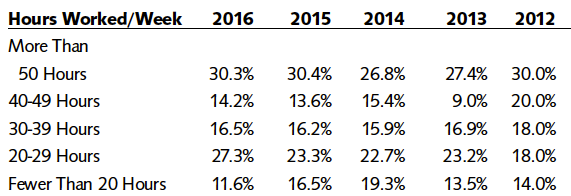
It comes as no surprise to those who understand the horse business that many horse people work more than 40 hours per week (with 44.5% responding that they work 40 or more hours). Here is the breakdown of all responses to the question of how many hours people work per week in their equine businesses:
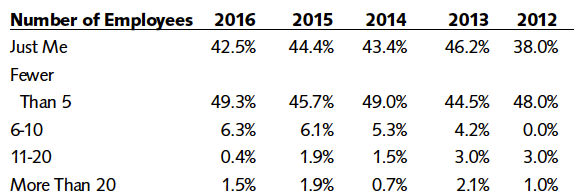
The majority of respondents in the survey said they have fewer than five employees, and more than 42% are the sole “employee” at their facilities.
In 2013, many respondents wanted more information about what equine farm/stable employees were paid. We included in our survey questions about how many people had a full-time barn/farm manager, and what these facilities paid those people. The majority of barns do not employ a manager, but for those that do, fewer than 8% pay a salary with benefits.
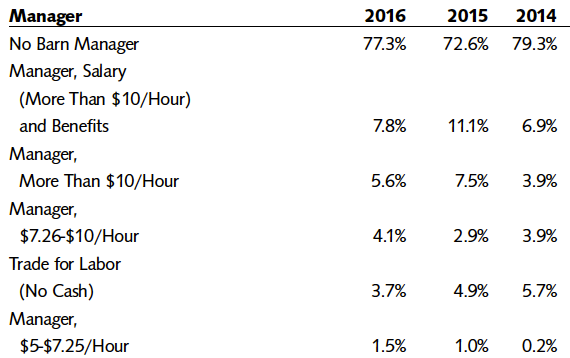
We had many respondents from last year ask whether benefits were given to managers and staff. Those who answered “Other” included free housing, cell phone, tips, gifts and horse boarding.
Economics
Expenses related to horse keeping have been in the news for years. The prices of grain, hay and fuel are visible increases that have been discussed, although grain and gas prices were down in 2016. Mortgages and insurance showed increases from last year, as did vet/farrier expenses. Here are the salary survey respondents’ biggest expenses for their businesses:
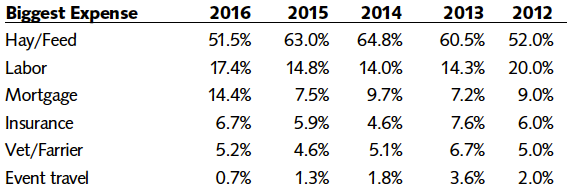
Some equine businesses listed other responses, including maintenance, bedding and taxes for labor.
Take-Home Message
Surveys only take into account a small portion of the equine industry, but these members of the Stable Management community have given us some insights into the health of this segment of the equine industry.
Use these figures as benchmarks to see how your equine busi- ness is doing compared to the industry as a whole. Go back and use the Spring Fees Survey in conjunction with these benchmarks to see how you could improve your bottom line and make your equine business more profitable.
We invite your feedback and suggestions about how to make the information we collect in our surveys more useful to you throughout the year.